Personas and Scenarios can be an effective resource when developing a user centric taxonomy, particularly for governments. This case study looks at the how this was accomplished for the provincial government of Newfoundland and Labrador.
When the Government of Newfoundland and Labrador embarked on a Web Renovation Project in preparation for the implementation of a content management solution, they performed various house cleaning’ tasks including organizing and validating content, organizing servers, developing a new user interface standard, developing an information architecture and taxonomy, and developing a set of user Personas and Scenarios.
This case study will examine the process used to develop the personas and scenarios, as well as some of the tangential outcomes that helped to drive the web initiative.
Personas are fictional characters representative of actual groups of users and their needs. They serve as a quick reference and reminder of who you’re designing for. Scenarios describe the persona’s process in achieving a goal and highlights opportunities for features and functionality development. Personas and Scenarios are tools that allows for a greater understanding of users, positions users at the center of the design process, and simplifies design decisions. When effectively used, personas and scenarios result in improved user experience, more satisfied users, and repeat visitors.
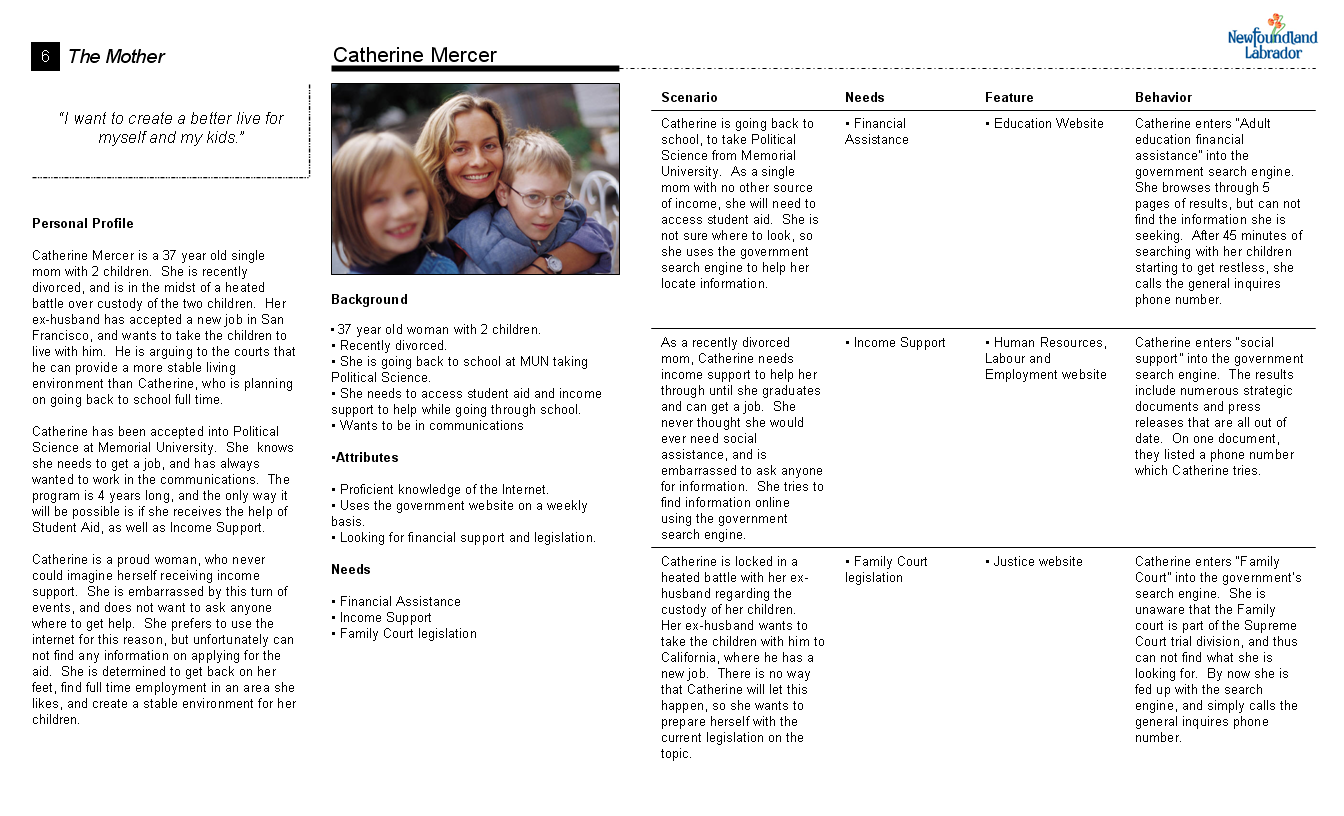
Fig. 1 – Example of a Persona and Scenario – Click to Enlarge
The process of developing personas and scenarios is comprised of three stages: identifying market segments, data collection, and development of the personas.
Market Segments
Early analysis of the web traffic highlighted a significant amount of traffic generated from government employees. This discovery was interesting in that it shows that the government website is not only an important tool for the public, but also it’s employees. From this discovery, two primary user groups were identified: Employees and Public.
Data Collection
Ideally, one on one interviews would be held to gather data on the various segments, however, due to the scope, and time limitations, the research was limited to three mechanisms for gathering data:
- A web based survey on the front page of all departmental websites,
- an email survey sent to each department, and
- analyzing the web logs from each of the departmental websites.
Web Survey
A Web survey was deployed on all main government web pages to gather information regarding who visits our sites, what they are looking for, if they have any difficulty finding that information, and what (if anything) may be missing that we could provide in any future designs. The survey focused on the two primary user groups (government employees and public), branching into two separate streams of questions for each group. The questions and available responses are detailed in the next section.
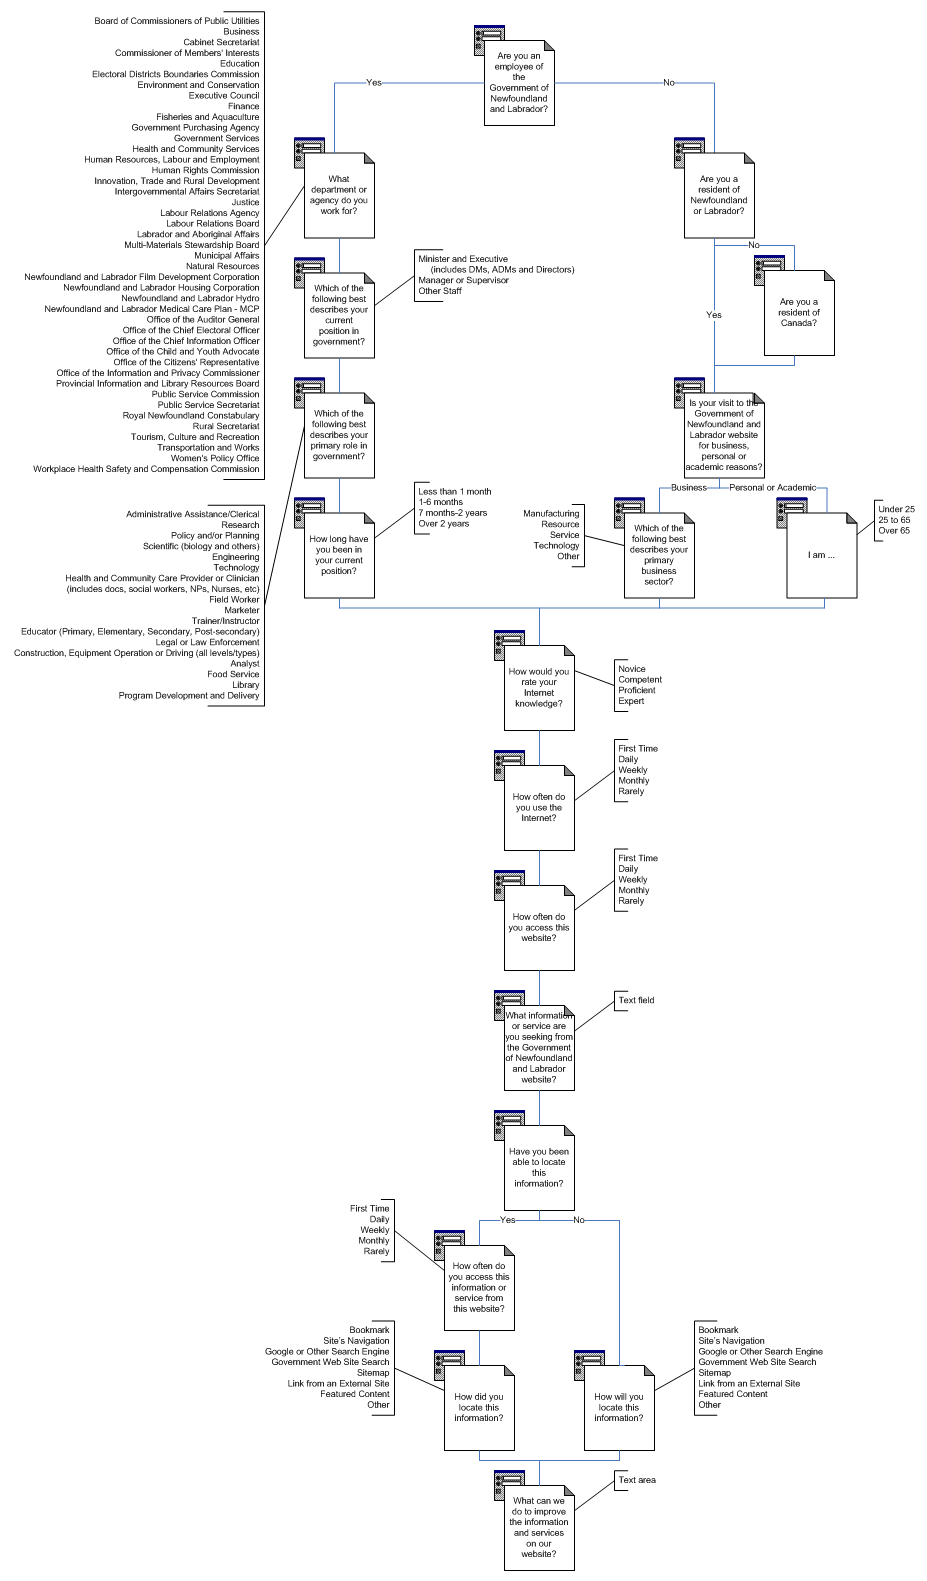
Fig. 2 – Survey Questions and Logic – Click to Enlarge
Web Survey Results
There were 1957 responses to the online survey over the two week period. Many of the questions were used to derive the persona attributes, but two questions let the public and employees respond with what information and services they were looking for, and how they thought the website could be improved. These question were left unstructured, allowing the respondents to speak their mind. The results were then categorized, grouped, and ranked. The results have been charted for both the public and employees.
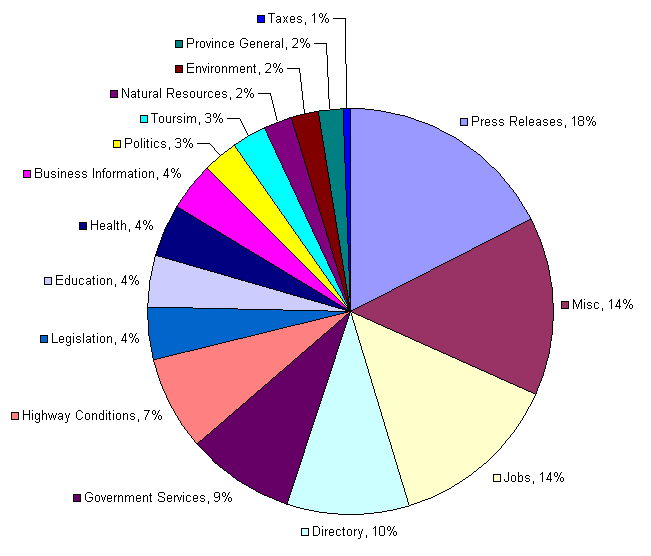
Fig. 3 – Information and Services Sought by the Public – Click to Enlarge
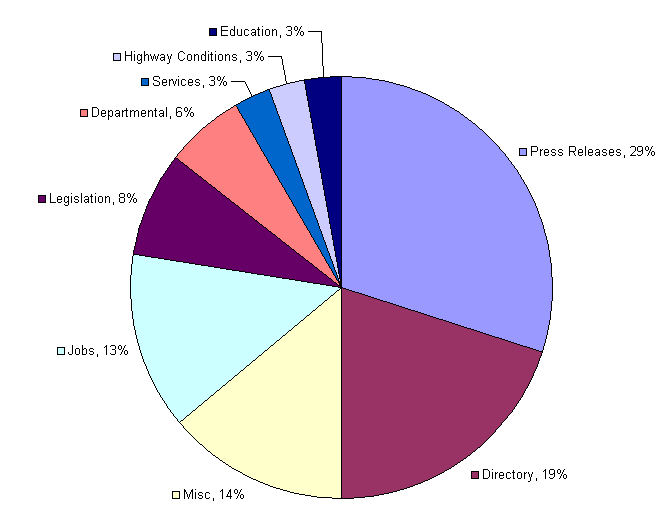
Fig. 4 – Information and Services Sought by the Employees – Click to Enlarge
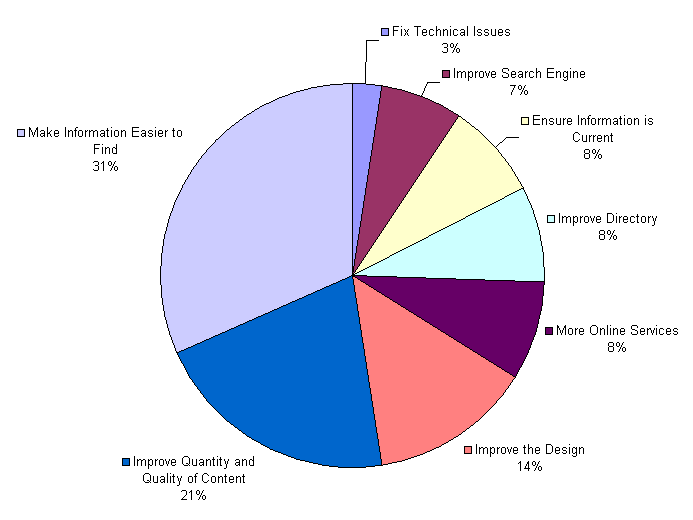
Fig. 5 – Areas the Public Felt Needed Improvement – Click to Enlarge
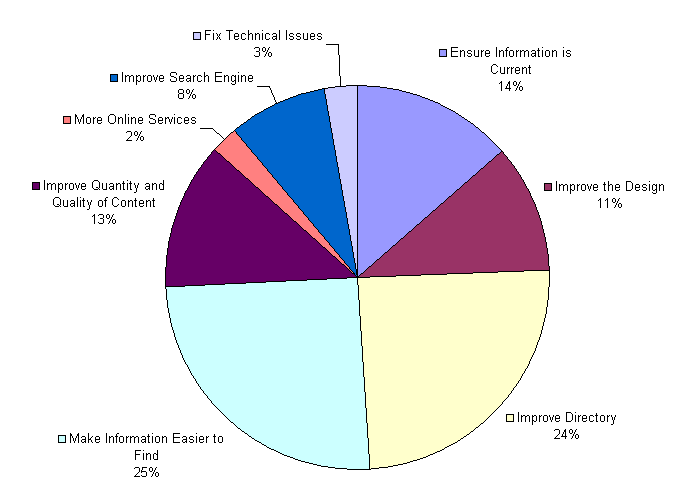
Fig. 6 – Areas the Employees Felt Needed Improvement – Click to Enlarge
Web Survey Key Findings
From the analysis of the responses, there were several key findings:
- Government employees represent a significant percentage of the site’s usage.
40% of all respondents were employees, which is in line with our analysis of the web logs. The web logs also show that this trend has been increasing for the past several years. This is significant as it shows how the web site has become an integral tool in the performance of day to day tasks. - Press Releases, Job Board and the Telephone Directory receive the majority of traffic.
These three items represent 42% of all public traffic and 61% of all employee traffic. - The most common request for improvement was to make things easier to find.
31% of the public said that they could not find the content they were seeking. 25% of the employees said that they found it hard to find the content, but only 8% were ultimately unsuccessful. This highlights the need for a focused initiative to improve the site’s information architecture. - Less than one third of the desired improvements will be aided by the implementation of a content management system.
A content management system facilitates the improvement of the quality, quantity and currency of content. This was requested by 29% of the public and 27% of the employees. - Other areas of improvement include the site’s design, telephone directory and search engine.
These improvements were requested by 26% of the public and 46% of the employees.
Summary of Attributes Assigned to Personas
The responses from the survey were then used to populate the attributes of the personas. We wanted to proportionally represent the employees and public, and settled on 10 personas to do this (4 employees and 6 public personas). This is a little more than what we would ordinarily develop, but considering the two user segments (public and employees) it was required to fully represent all the attributes. Names and photos were selected as well to start the development process.
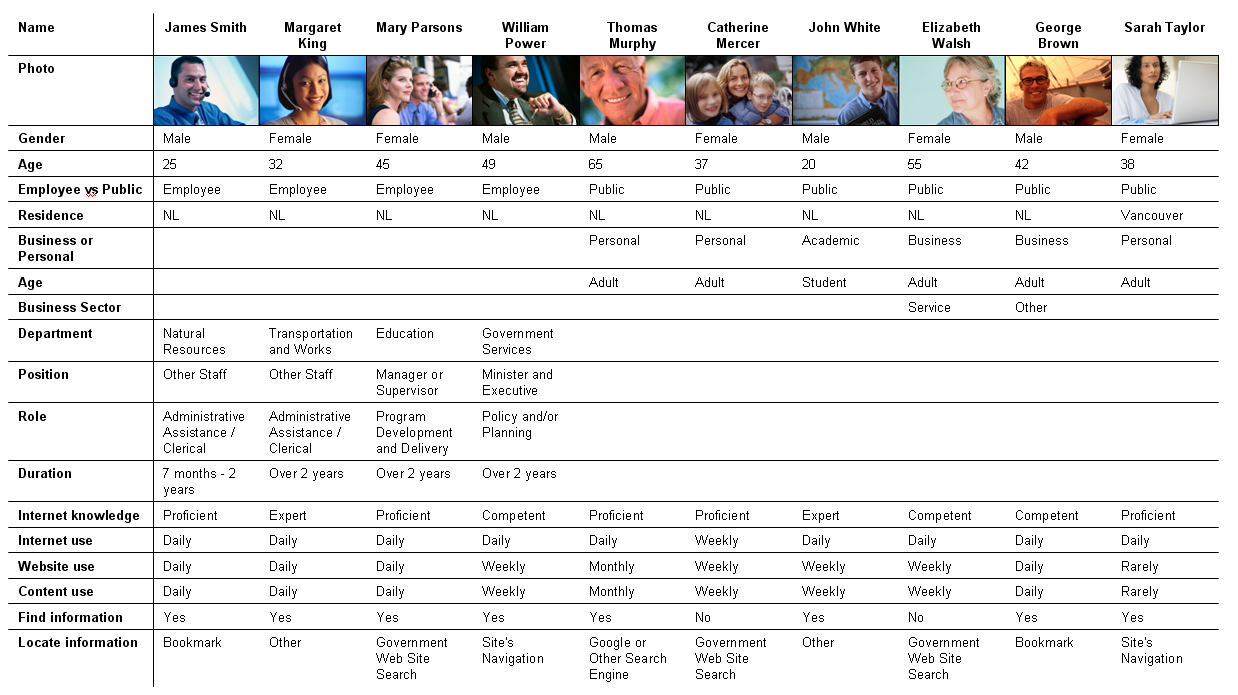
Fig. 7 – Survey Data Applied to Personas – Click to Enlarge
Email Survey
An email survey was distributed to all departments to retrieve more specific information on the types of information and services being sought by the public and other government workers. Departments were asked to respond with the top ten requests for information or services, and who generally makes the request.
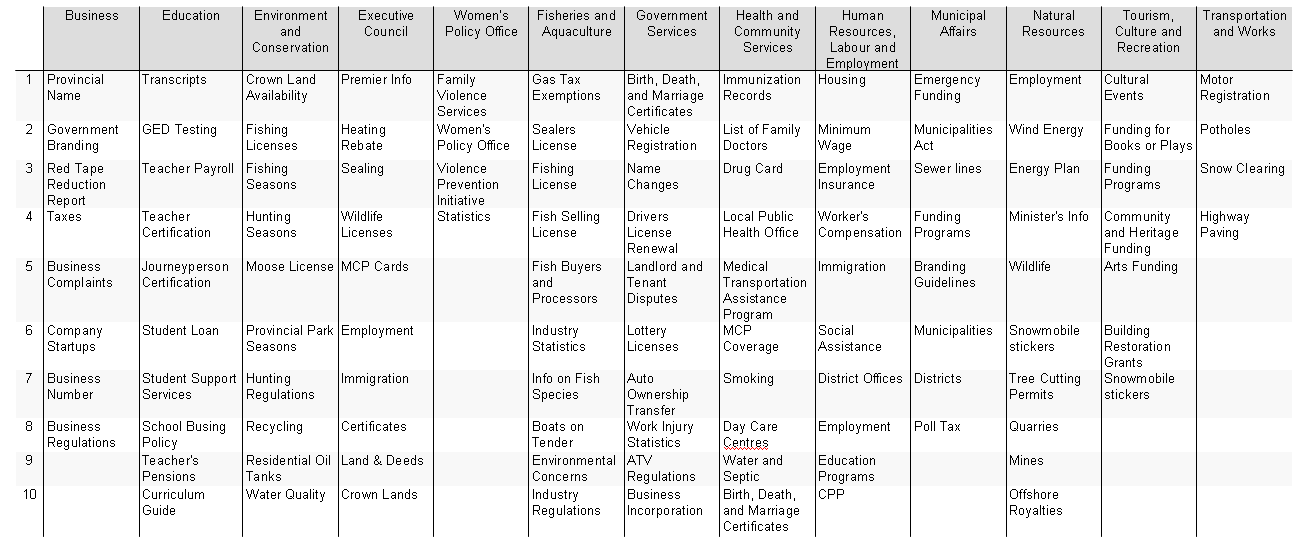
Fig. 8 – Responses from Departmental Email Survey – Click to Enlarge
Web traffic logs
An analysis of the governments web logs was carried out to determine actual traffic to different departmental website. These results are combined with the survey results to help generate realistic scenarios for the ten personas. The Government of Newfoundland and Labrador manages over 50 individual websites, that generate in excess of 50 million pages views a year.
Analysis of the annual traffic by website generates a proportional view of the information or services that the public and employees are seeking. Further analysis of the monthly traffic highlights seasonal trends in website traffic, which can be used to deduce specific information or services. Analysis reveals six websites that possess spikes in traffic that exceed the standard deviation by more than 25%. The sites and the peak month(s) are as follows:
- News Releases – November
- House of Assembly – March
- Public Service Commission – April and May
- Education – May and September
- Environment – April and May
- Student Aid – April
Summary of Traffic Statistics Assigned to Personas
Data from the web logs, email survey, and web site survey were used to develop information and services sought by our personas. The information and services would form the basis of the scenarios for each persona. The information and services has been mapped to the personas in the table blow
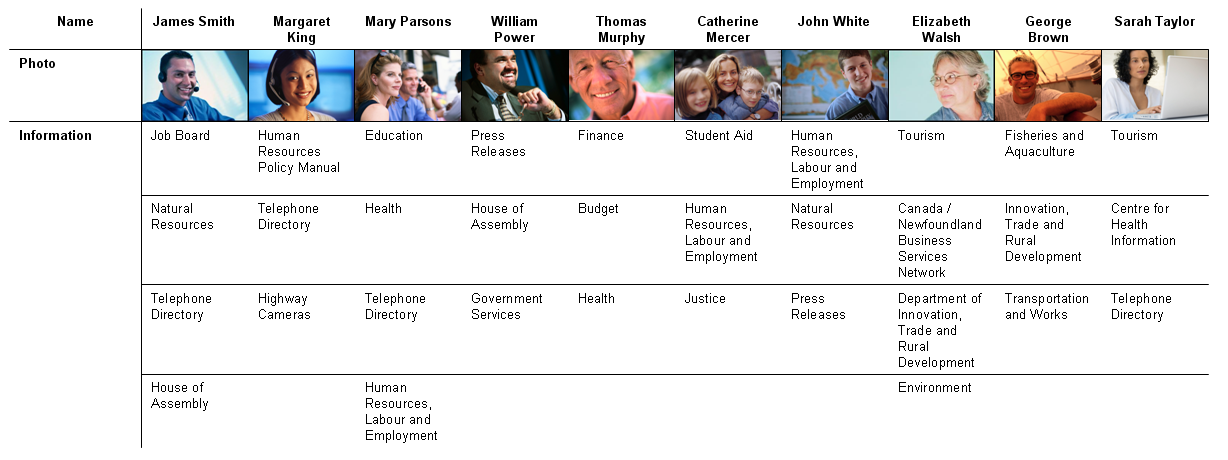
Fig. 9 – Web Traffic Analysis added to Personas and Scenarios – Click to Enlarge
Development of Personas and Scenarios
Having established our list of personas with corresponding attributes and information or services they are seeking, it was now time to develop the personas and the related scenarios. This is where creative writing plays a major role. Stories were developed to match the attributes with the activities. The resulting 10 personas and scenarios Gov_NL_Personas_and_Scenarios can be downloaded as a pdf.
Outcomes
The results of the online survey have been instrumental in developing the personas and scenarios for the web strategy project. They are also very useful in helping to give direction to the web strategy going forward.
From the online survey analysis, we can see a strong correlation between what people are looking for, and what they would like to see improved on the web site. This correlation highlights five areas where the government can achieve the highest return for its investment:
- Information Architecture
- Content Management
- Search Engine
- Directory
- Job Board
Information Architecture
Many of the comments from the survey respondents were task focused questions phrased as ‘How do I..’ or ‘I want to…’. The information architecture will have a greater impact if it is task-centric from the user’s perspective. As the tasks of employees can differ from that of the general public, some consideration may be given to a dual taxonomy structure. This solution is most appropriate with a content management system that is capable of customizing the users’ display based on the requesting IP address.
Content Management
When selecting the content management solution, higher priority should be given to the systems that help to improve the contents quantity, quality, and currency. These features should include the following:
- Ability to report on all content that has not been modified for a period of time by department, including the ability to automatically place those items back into workflow.
- Ability to track the publishing activity by department.
- Ability to perform bulk imports of data, including HTML files, Word documents, Excel spreadsheets, PDF documents, images, and rich media content.
- Ability to import content authored in a variety of different tools.
Search Engine
With 7% of the public requesting improvements to the governments search engine, this is not one of the highest priorities, but still is statistically significant. With 32% of the respondents indicating that they use the search engine, this improvement will benefit a large portion of the users. The solution needs to be fast and cost effective, which supports the current initiative to use Google mini.
Directory
One quarter of the employees and 8% of the public that responded indicated that they would like to see improvements made to the directory. Of primary concern was the currency of the data. This can be accomplished by providing a web interface directly to the government’s active directory. The government is currently implementing an active directory project. The Web Strategy group should investigate if this project encompasses a web interface that can be integrated with the government’s web site. There are numerous inexpensive add-ons to active directory for this purpose, such as http://www.nakisa.com, http://www.webactivedirectory.com, or http://www.intervate.com. To achieve the greatest value for the user, the product should include the following features:
- Ability to search by first and last name.
- Ability to filter by department
- Ability to search by job title or description.
- Ability to view an organization’s hierarchy.
Job Board
14% of the respondents use the job board. This is a significant portion of the users that could benefit from an improved features set of the job board. There are numerous low cost pre-built job board solutions, such as http://www.jobbex.com, or http://www.webscribble.com. Features of the solution should include:
- Ability to search jobs by location, date range, categories, Job type and keywords.
- Ability to view all jobs posted by a specific department.
- Ability to set up job notification agents to automatically get matching jobs by email everyday.
- Ability to submit your resume to any registered employer from your account with one click.
Leave A Comment
You must be logged in to post a comment.